"use client";

import IsotypeStats from "@/components/ui/isotype-stats";

export default function IsotypeStatsDemo() {
  return (
    <div className="flex min-h-full w-full items-center justify-center px-4 py-12 bg-[#f1eee6] text-[#1b1a17]">
      <div className="w-full max-w-3xl">
        <p className="font-mono text-[11px] uppercase tracking-[0.16em] text-[#1f4e8c]">
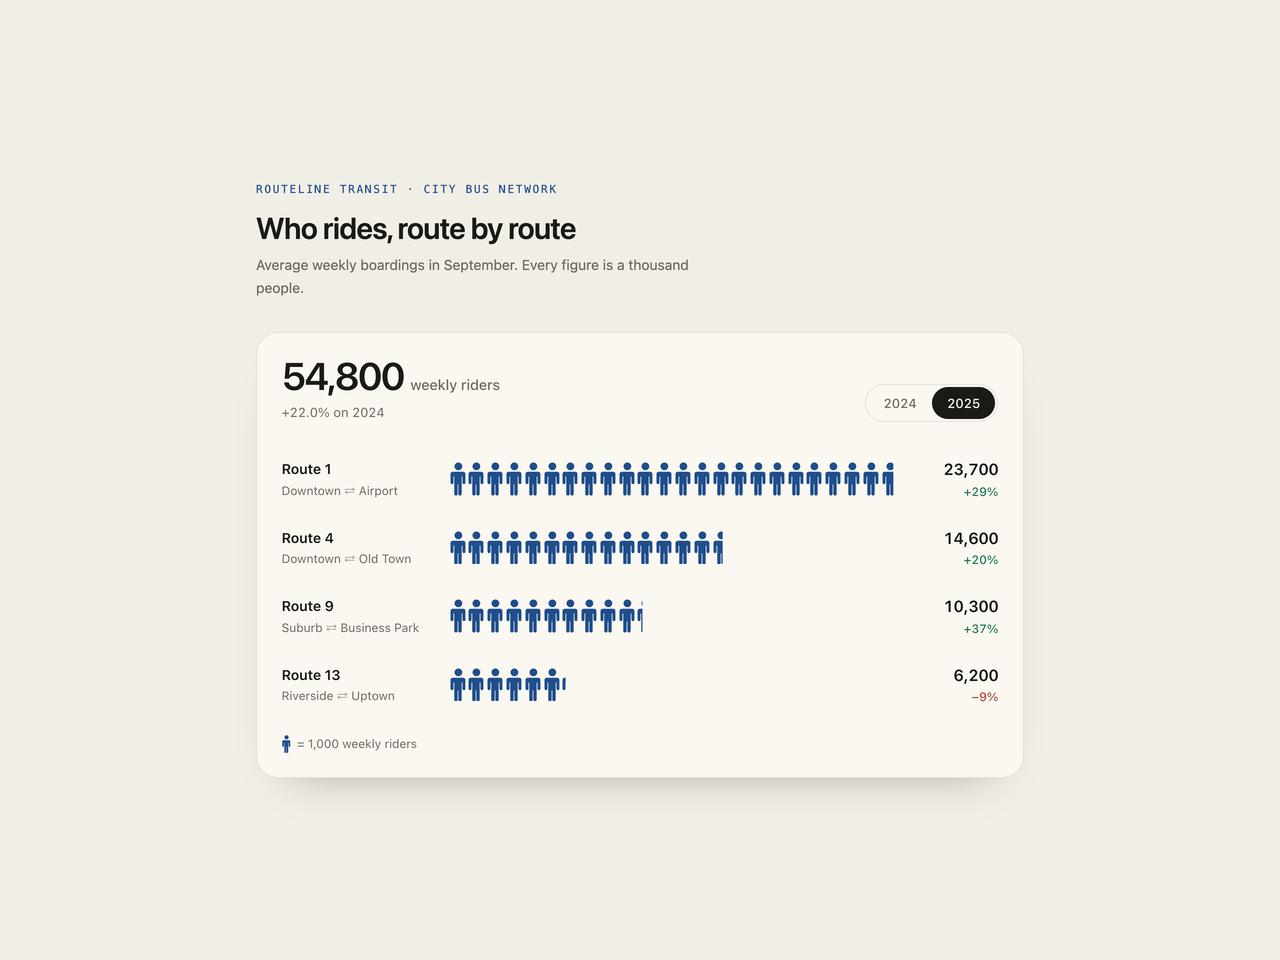
          Routeline Transit · City bus network
        </p>
        <h2 className="mt-3 text-2xl font-semibold tracking-tight sm:text-3xl">
          Who rides, route by route
        </h2>
        <p className="mt-2 max-w-md text-sm leading-relaxed text-[#6f6a62]">
          Average weekly boardings in September. Every figure is a thousand
          people.
        </p>
        <IsotypeStats
          className="mt-8"
          theme="paper"
          title="Weekly riders by route"
          periods={["2024", "2025"]}
          unit={1000}
          noun="weekly riders"
          rows={[
            {
              label: "Route 1",
              note: "Downtown ⇄ Airport",
              values: { "2024": 18400, "2025": 23700 },
            },
            {
              label: "Route 4",
              note: "Downtown ⇄ Old Town",
              values: { "2024": 12200, "2025": 14600 },
            },
            {
              label: "Route 9",
              note: "Suburb ⇄ Business Park",
              values: { "2024": 7500, "2025": 10300 },
            },
            {
              label: "Route 13",
              note: "Riverside ⇄ Uptown",
              values: { "2024": 6800, "2025": 6200 },
            },
          ]}
        />
      </div>
    </div>
  );
}